×

Powered by TNTSearch

  • 📝 Home

    Aug 24, 2026 Annoucement: ​

  • 📝 [BTC] Strategy Monitor — Elliott Wave + Cycle Theory

    Aug 24, 2026 BTC Strategy Monitor — Elliott Wave Cycle Theory Date: August 24, 2026 Current Price: $76,954 | 24h

  • 📝 [BTC] Chart Analysis

    Sep 07, 2026 title: BTC Chart Analysis Sep 5, 2026 published: true menu: BTC Analysis BTC/USD Chart Analysis Bas

  • 📝 [BTC] 4-Year Cycle Theory — Monthly Timeframe

    Aug 24, 2026 BTC 4Year Cycle Theory — Monthly Timeframe Date: August 24, 2026 Current Price: $76,978 | ATH: $126,

  • 📝 [BTC] Log Channel Analysis — Updated to Aug 2026

    Sep 07, 2026 Bitcoin Log Channel Analysis — Updated to Aug 2026 Date: August 26, 2026 Current Price: $79,080 Char

  • 📝 [BTC] MVRV Z-Score Analysis - Aug 2026

    Aug 24, 2026 BTC Weekly Chart Analysis August 2026 MVRV ZScore: 0.841 Macro Bottom Zone The chart below shows B

  • 📝 [BTC] Cycle Projection — Distribution → Accumulation → Parabolic Rally

    Aug 24, 2026 BTC Cycle Projection — Distribution → Accumulation → Parabolic Rally Date: August 24, 2026 Current P

  • 📝 BTC Pump & Dump — September 7, 2026

    Sep 07, 2026 image: btcsept72026.jpg BTC Pump & Dump — September 7, 2026 The Setup Bitcoin was consolidating

  • 📝 [LINUX] Upgrading LXC Container: Debian 12 to 13

    Aug 24, 2026 Upgrading LXC Container from Debian 12 (Bookworm to Debian 13 (Trixie Warning Warning: Always take

  • 📝 [BTC] Bear Market Floor Power Law

    Aug 24, 2026 This is a "Bitcoin Bear Market Floor Power Law" chart — it's a mathematical model that tries to pred

  • August 24, 2026 at 8:41 AM
    📝 [BTC] Bear Market Floor Power Law

    Bitcoin Bear Market Floor Power Law

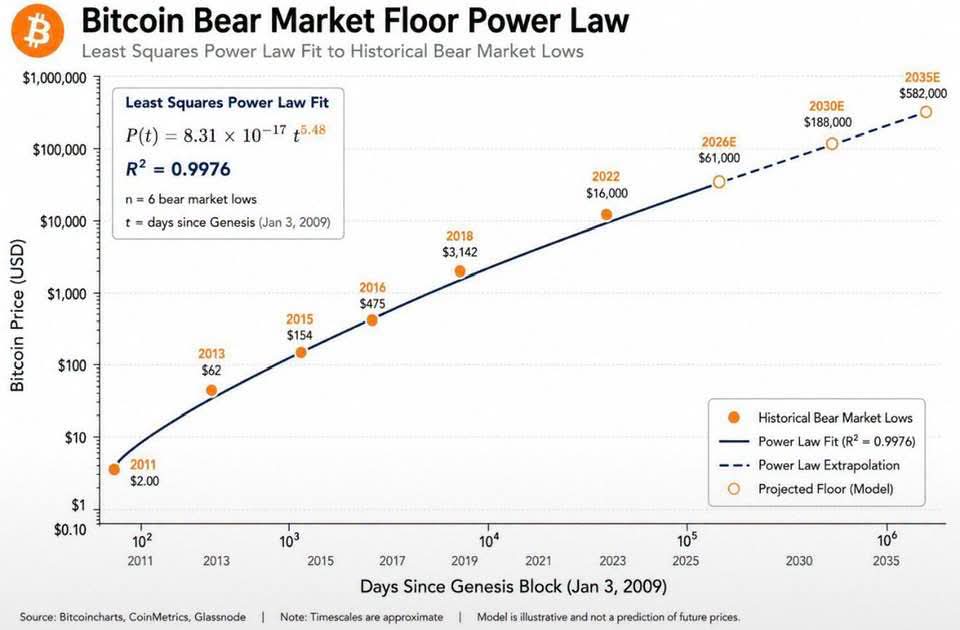
    This is a "Bitcoin Bear Market Floor Power Law" chart — it's a mathematical model that tries to predict how low Bitcoin's price will go during future bear markets based on historical data.

    What it shows:

    • 6 historical bear market lows plotted as orange dots: $2 (2011) → $62 (2013) → $154 (2015) → $475 (2016) → $3,142 (2018) → $16,000 (2022)
    • A power law trend line (the equation in the top-left) that fits these points with an R² of 0.9976 — meaning the model fits the past data extremely well
    • Future projections (dashed line, hollow circles): $61K in 2026, $188K in 2030, $582K in 2035

    The theory behind it: Every time Bitcoin goes through a bear market, the bottom is higher than the previous one, and the gap between lows grows over time. On a log-log scale, this creates a nearly straight line — hence the "power law" fit.

    Caveat: The chart itself notes it's "illustrative and not a prediction of future prices." The model is purely mathematical — it doesn't account for things like adoption curves, regulatory changes, macroeconomic shifts, or whether Bitcoin's price dynamics will actually continue following this pattern. It's a neat visualization of a historical trend, but not a crystal ball.


    ⚠️ NFA Disclaimer: This is not financial advice. The model presented is purely illustrative and should not be used as the sole basis for any investment decisions. Always do your own research and consult with a qualified financial advisor before making any investment decisions.

    Generated by AI — not a substitute for professional analysis.