September 07, 2026 at 4:10 PM
📝
[BTC] Chart Analysis
title: BTC Chart Analysis - Sep 5, 2026 published: true menu: BTC Analysis
BTC/USD Chart Analysis
Based on chart shared 05/09/26 — source: @cryptolens (TradingView)
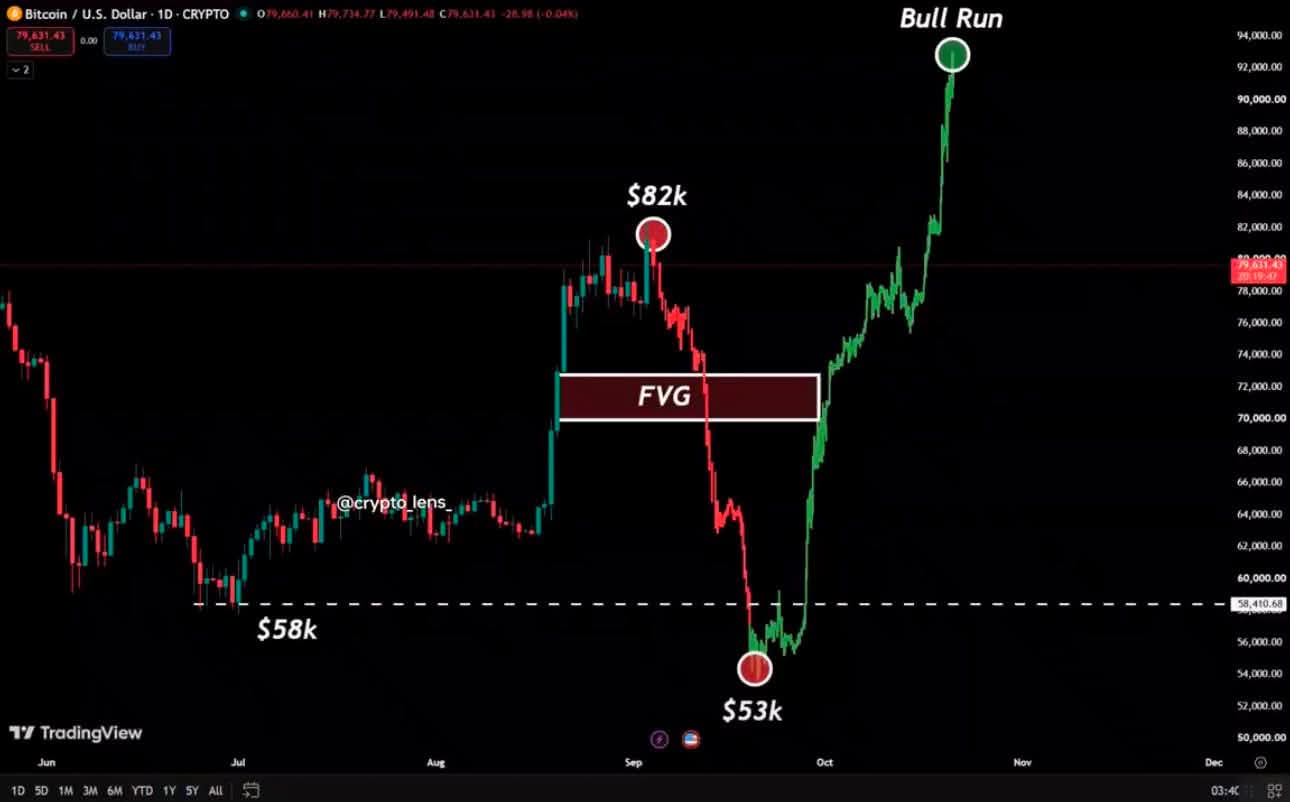
Chart Timeframes & Price Levels
| Event | Date | Price Level | Notes |
|---|---|---|---|
| $82k Peak | Late Sep 2026 | ~$82,000 | Local top before correction |
| FVG Zone | Mid-Sep – Early Oct 2026 | $70,000 – $72,000 | Fair Value Gap (Smart Money Concepts) |
| $53k Low | Early Oct 2026 | ~$53,000 | Market bottom / capitulation low |
| $58k Support | Oct – Nov 2026 | $58,410.68 | Key horizontal support (dashed line) |
| Bull Run Peak | Late Nov 2026 | ~$94,000 | Cycle high |
| Chart Screenshot Price | Date of screenshot | $79,631.41 | Open: $79,660 / High: $79,734 / Low: $79,491 |
Price Range Covered: Jun 2026 – Dec 2026 (Daily candles) Y-Axis Range: $50,000 – $94,000
Current Price Comparison
| Metric | Value |
|---|---|
| Chart Screenshot Price | $79,631.41 |
| Current Live Price (Sep 5, 2026) | ~$79,650 – $79,700 |
| vs Chart Peak ($94k) | -15.3% below cycle high |
| vs Chart Low ($53k) | +50.2% above capitulation low |
| vs $58k Support | +37.4% above key support |
| vs FVG Zone ($70k–$72k) | Inside/above — reclaimed |
Key Observations
- BTC is currently trading at essentially the same level as the screenshot (~$79,650), suggesting the market has been range-bound since the chart was taken.
- The FVG zone ($70k–$72k) that was once resistance has been reclaimed and now sits below current price — a bullish structural shift.
- Price is roughly 15% off the $94k cycle high but still 50%+ above the $53k bottom.
- The $58,410 support remains intact and untested at current levels.
Disclaimer
⚠️ Not Financial Advice (NFA) — This analysis is for informational and educational purposes only. It is generated by AI and does not constitute investment, trading, or financial advice. Cryptocurrency markets are highly volatile and risky. Always do your own research (DYOR) and consult a qualified financial advisor before making any investment decisions. Past performance does not guarantee future results.