August 24, 2026 at 2:48 PM
📝
[BTC] Cycle Projection — Distribution → Accumulation → Parabolic Rally
[BTC] Cycle Projection — Distribution → Accumulation → Parabolic Rally
Date: August 24, 2026 Current Price: $77,186 | Projection Period: Dec 2026 – Sep 2027 Target: $100,000+ by September 2027
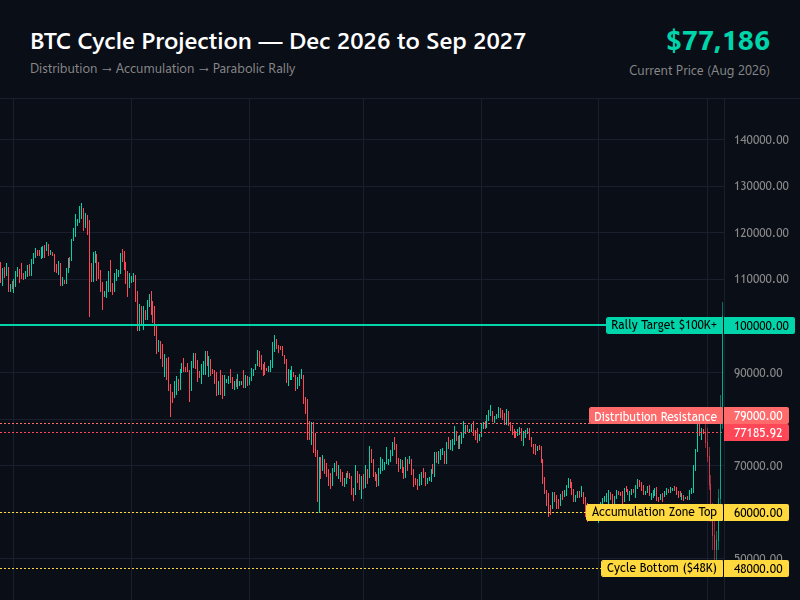
Cycle Projection Overview
This analysis projects the next major BTC cycle phase based on historical 4-year patterns and current market structure. The cycle moves through four distinct phases:
| Phase | Timeline | Price Range | Description |
|---|---|---|---|
| Distribution | Dec 2026 – Jan 2027 | $77K → $72K | Smart money exits positions, price consolidates near current levels |
| Major Drop | Feb 2027 – Mar 2027 | $72K → $60K | Sharp 20% correction, panic selling begins |
| Accumulation | Apr 2027 – Jun 2027 | $60K → $48K | Price consolidates in the $48K–$60K range, cycle bottom forms in June |
| Parabolic Rally | Jul 2027 – Sep 2027 | $48K → $100K+ | Explosive upside move, 100%+ gains from bottom |
Key Technical Levels
| Level | Price | Significance |
|---|---|---|
| Distribution Resistance | $79,000 | Current resistance zone — a break above extends the distribution phase |
| Accumulation Zone Top | $60,000 | Upper boundary of the accumulation range |
| Cycle Bottom | $48,000 | Projected absolute low — major accumulation opportunity |
| Rally Target | $100,000+ | First major psychological resistance on the way up |
Cycle Analysis
Phase 1: Distribution (Dec 2026 – Jan 2027)
- Price remains range-bound between $72K–$79K
- Volume declines as institutional players distribute positions
- Retail FOMO continues, creating a false sense of stability
- Action: Reduce exposure, take partial profits
Phase 2: Major Drop (Feb 2027 – Mar 2027)
- Break below $70K triggers stop-losses and margin calls
- Price drops from $72K to $60K in roughly 2 months
- Media turns bearish, "BTC is dead" narratives emerge
- Action: Begin accumulating small positions, stay patient
Phase 3: Accumulation (Apr 2027 – Jun 2027)
- Price oscillates between $48K–$60K for 3 months
- June marks the cycle bottom — the lowest point of this cycle
- Volume dries up, sentiment reaches extreme fear
- Action: Dollar-cost average into the bottom zone, prepare for the rally
Phase 4: Parabolic Rally (Jul 2027 – Sep 2027)
- Break above $60K confirms the trend reversal
- July: $54K → $63K (gradual recovery)
- August: $63K → $82K (acceleration begins)
- September: $82K → $100K+ (parabolic move)
- Action: Hold through the rally, take profits near $100K
Historical Context
This cycle pattern mirrors previous 4-year cycles:
- 2016-2017: Distribution → Drop to ~$1,600 → Accumulation → Rally to $20K
- 2020-2021: Distribution → Drop to ~$3,800 → Accumulation → Rally to $69K
- 2024-2025: Distribution → Drop to ~$42K → Accumulation → Rally to $126K (ATH)
- 2026-2027: Distribution → Drop to ~$48K → Accumulation → Rally to $100K+
Risk Factors
- Extended Distribution: If price holds above $79K through Q1 2027, the cycle may extend longer
- Shallow Correction: If the drop only reaches $55K–$60K before reversing, this is a bullish signal
- Regulatory Impact: Any major regulatory action could accelerate the drop or delay the rally
- Macro Conditions: Global liquidity conditions (Fed policy, QE) heavily influence cycle timing
Disclaimer: This content is generated by AI for informational purposes only and does not constitute financial advice (NFA). Always do your own research and consult a licensed financial advisor before making investment decisions.