August 24, 2026 at 2:11 PM
📝
[BTC] Strategy Monitor — Elliott Wave + Cycle Theory
[BTC] Strategy Monitor — Elliott Wave + Cycle Theory
Date: August 24, 2026 Current Price: $76,954 | 24h Range: $75,775 – $78,013 | 30d Range: $62,275 – $79,500 7d Change: +22.1% | 30d Change: +20.2% | ATH: $126,080 (–39%)
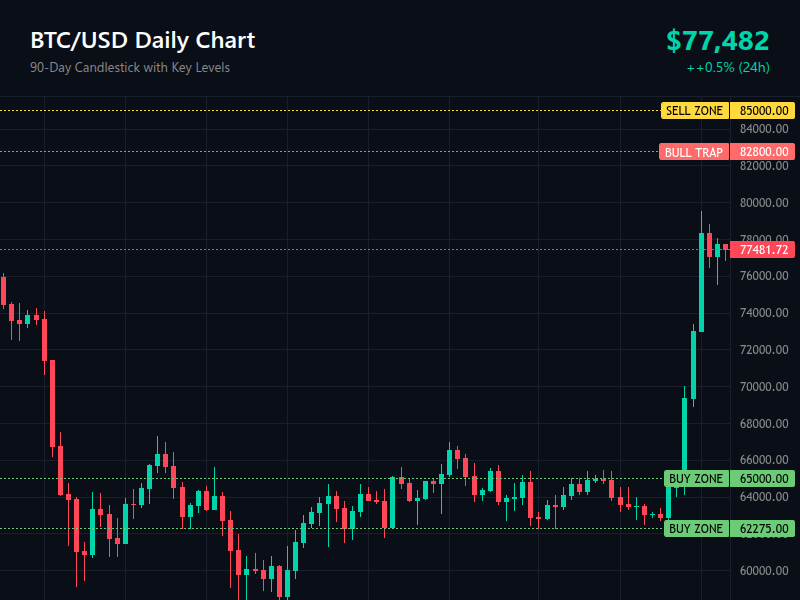
Strategy 1: Elliott Wave / Fibonacci (Daily Timeframe)
Key Levels to Monitor:
| Level | Price | Type | Action if Reached |
|---|---|---|---|
| Bull Trap Level | $82,800–$83,500 | Strong resistance | If price rallies here and fails to break — bearish confirmation, short signal |
| Sell Zone | $85,000–$90,000 | Distribution area | If price enters and shows rejection — exit longs, consider shorts |
| Fib 0.382 (30d swing) | ~$72,860 | Near-term support | Price currently testing this level. Break above = bullish continuation toward $80K+ |
| Fib 0.5 (30d swing) | ~$70,890 | Intermediate support | If held — bullish consolidation. If broken — deeper decline toward $68K |
| Fib 0.618 (30d swing) | ~$68,905 | Major support | Last line of defense for the 30-day rally. Break here = bearish |
| Buy Zone | $62,000–$65,000 | 30d swing low / accumulation | If price returns here — strong buy signal. Also aligns with $62,275 low (Aug 14) |
Daily Wave Completion Rules:
Impulse wave confirmed if:
- Price breaks above $79,500 (30d high) with volume >$3B daily and holds above — confirms continuation toward $82K+ zone
Wave top / distribution confirmed if:
- Price reaches $82,800–$83,500 (bull trap level) AND shows bearish divergence (RSI/MACD) — high-probability short
- OR price hits $85,000+ and gets rejected on high volume — distribution phase confirmed
Final crash wave (c) complete if:
- Price drops into $62,000–$65,000 buy zone AND shows bullish divergence or hammer candle — cycle bottom probable
- OR price holds $68,900 (Fib 0.618) with decreasing sell volume — bounce likely
Current Market Context (Aug 24):
- BTC is in a strong rally phase (+22% in 7 days) after bouncing from $62,275 (Aug 14 low)
- Price is consolidating at $76K–$78K, right at the Fib 0.382 level — critical decision point
- A clean break above $79,500 opens the path to $82,800 (bull trap)
- Failure here with declining volume could signal a pullback to $70,890 or $68,900
- Key observation: The 0.382 retracement of the full ATH cycle ($67 → $126K) sits at ~$77,954 — price is essentially testing the ATH-cycle 0.382 right now. A breakout above this would be a major bullish signal.
Disclaimer: This content is generated by AI for informational purposes only and does not constitute financial advice (NFA). Always do your own research and consult a licensed financial advisor before making investment decisions.