September 07, 2026 at 4:11 PM
Bitcoin Log Channel Analysis — Updated to Aug 2026
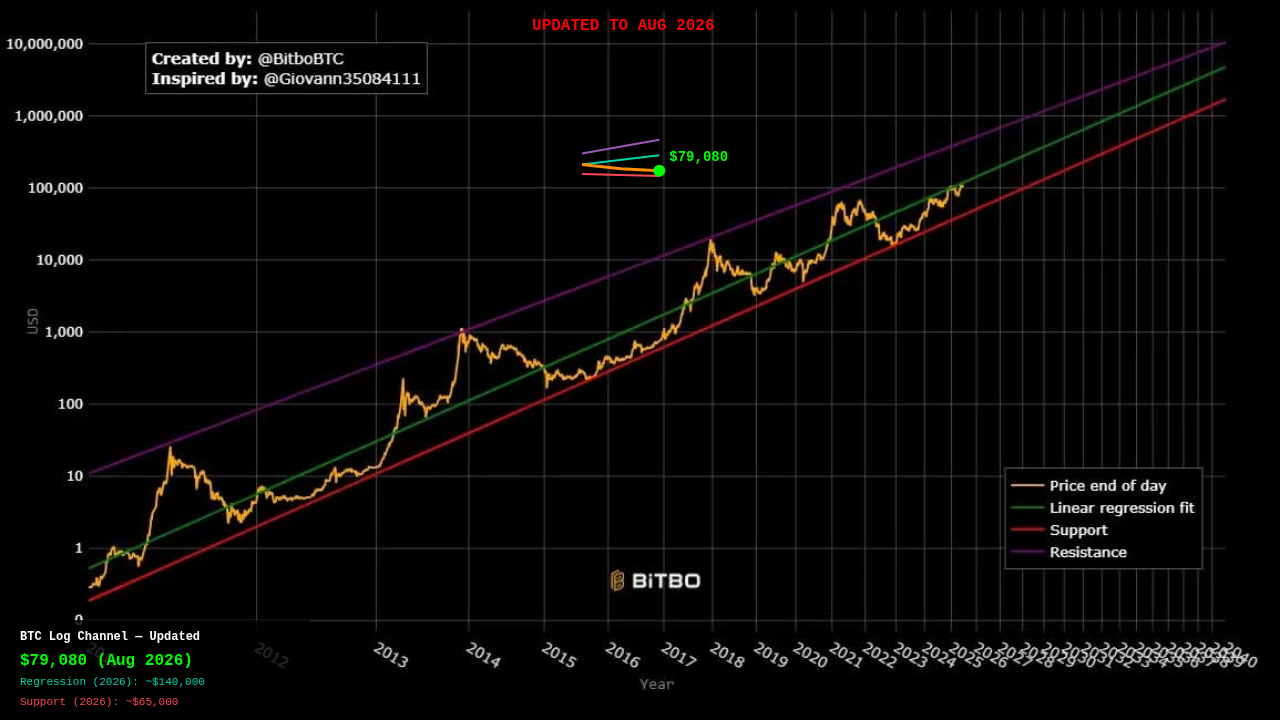
Date: August 26, 2026 Current Price: $79,080 Chart: Original log channel by @BitboBTC (inspired by @Giovann35084111) with continuation to present
Overview
This chart plots Bitcoin price on a logarithmic scale from 2011 through August 2026, overlaid with a linear regression fit and channel boundaries (support/resistance). The log channel demonstrates Bitcoin's consistent exponential growth within a defined price band.
The original chart by @BitboBTC projected the log channel out to 2040. This update extends the orange price line and continuation lines from the 2024 endpoint (~$100K) through to the present (Aug 2026, ~$79K).
Current Position (Aug 2026)
- Current Price: $79,080
- Regression (Fair Value): ~$140,000
- Support Level: ~$65,000
- Resistance Level: ~$250,000
Bitcoin is currently trading below the regression line, approaching the support boundary of the log channel.
Chart Legend
| Line | Color | Description |
|---|---|---|
| Orange | #ff8c00 | Price end of day (actual price) |
| Green | #00d4aa | Linear regression fit (long-term trend) |
| Red | #ff4757 | Support line (lower boundary) |
| Purple | #9b59b6 | Resistance line (upper boundary) |
Price Action Summary
- 2024: BTC reached ~$100K near the end of the year
- 2024–2025: Correction phase, price declined to ~$85K
- 2025–2026: Continued consolidation, current price ~$79K
- Current: Trading below regression, testing support zone
Channel Projections (2026–2040)
The regression channel continues to project higher:
- 2026: Regression ~$140K, Support ~$65K, Resistance ~$250K
- 2040: Regression extrapolates toward $1.4M, Support toward $2–3M, Resistance toward $10M
Methodology
- Logarithmic Scale: Price axis uses log scale to better visualize percentage changes over time
- Linear Regression: Green line represents the best-fit linear regression on log-transformed prices
- Channel Boundaries: Red (support) and purple (resistance) lines form the channel, typically at ±2 standard deviations from the regression
Credits
- Original Chart: @BitboBTC
- Inspired by: @Giovann35084111
- Update: August 2026 continuation with current price data
Disclaimer: This content is generated by AI for informational purposes only and does not constitute financial advice (NFA). Always do your own research and consult a licensed financial advisor before making investment decisions.