August 24, 2026 at 2:11 PM
[BTC] 4-Year Cycle Theory — Monthly Timeframe
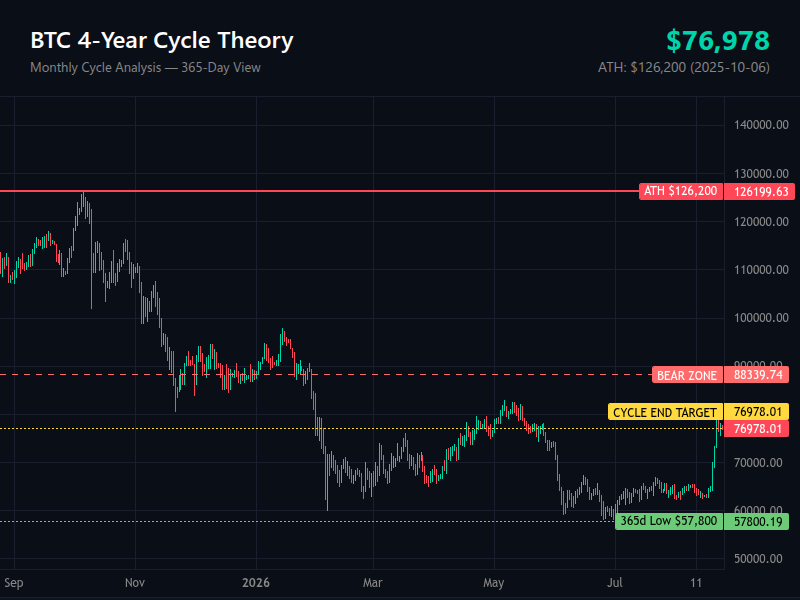
Date: August 24, 2026 Current Price: $76,978 | ATH: $126,200 (Oct 6, 2025) | 365d Low: $57,800 (Jul 1, 2026) Days in Bull Cycle: 997 / 1,035 | Days to Cycle End: 38 days
Cycle Parameters:
| Phase | Duration | Typical Timing |
|---|---|---|
| Bull Market | 1,035 days (~2.8 years) | Post-bottom accumulation → parabolic top |
| Bear Market | 396 days (~13 months) | Often starts in Q4 |
| Current Projected Bear | 243 days | Q4 2025–2026 |
| Cycle End Projection | Thu 01 Oct 2026 | Long-term bottom target |
Bull Phase Active:
If price is within the 1,035-day window from the last major bottom — stay positioned long, take profits near cycle top zones ($85K–$100K)
Bear Phase Trigger:
If price breaks below key support AND we're approaching Q4 — prepare for 396-day bear cycle
Current Status Check:
- Days since last major cycle bottom: Counting from the projected bull start (Dec 2023), we are at day 997 of the 1,035-day bull cycle
- Compare against 1,035-day bull / 396-day bear pattern: Currently at 96.3% of the bull cycle duration
- If within 243-day projected bear window: YES — we are in the final 38 days before the projected cycle end. Reduce exposure, wait for Buy Zone
End-of-Cycle Signal:
If we approach Oct 2026 and price is near cycle lows — major accumulation opportunity. The cycle theory projects a long-term bottom target of October 1, 2026, which aligns with the historical 4-year cycle pattern.
Key Observations:
- BTC is at 96.3% of the bull cycle duration (997/1,035 days)
- Only 38 days remain until the projected cycle end (Oct 1, 2026)
- Price is 39% below ATH ($76,978 vs $126,200) — typical mid-cycle correction pattern
- The 365d low of $57,800 (Jul 1, 2026) represents a 54% drawdown from ATH — consistent with historical bear market bottoms
- Current consolidation at $77K aligns with the cycle end target zone — watch for accumulation signals
Disclaimer: This content is generated by AI for informational purposes only and does not constitute financial advice (NFA). Always do your own research and consult a licensed financial advisor before making investment decisions.