August 24, 2026 at 8:40 AM
BTC Weekly Chart Analysis - August 2026
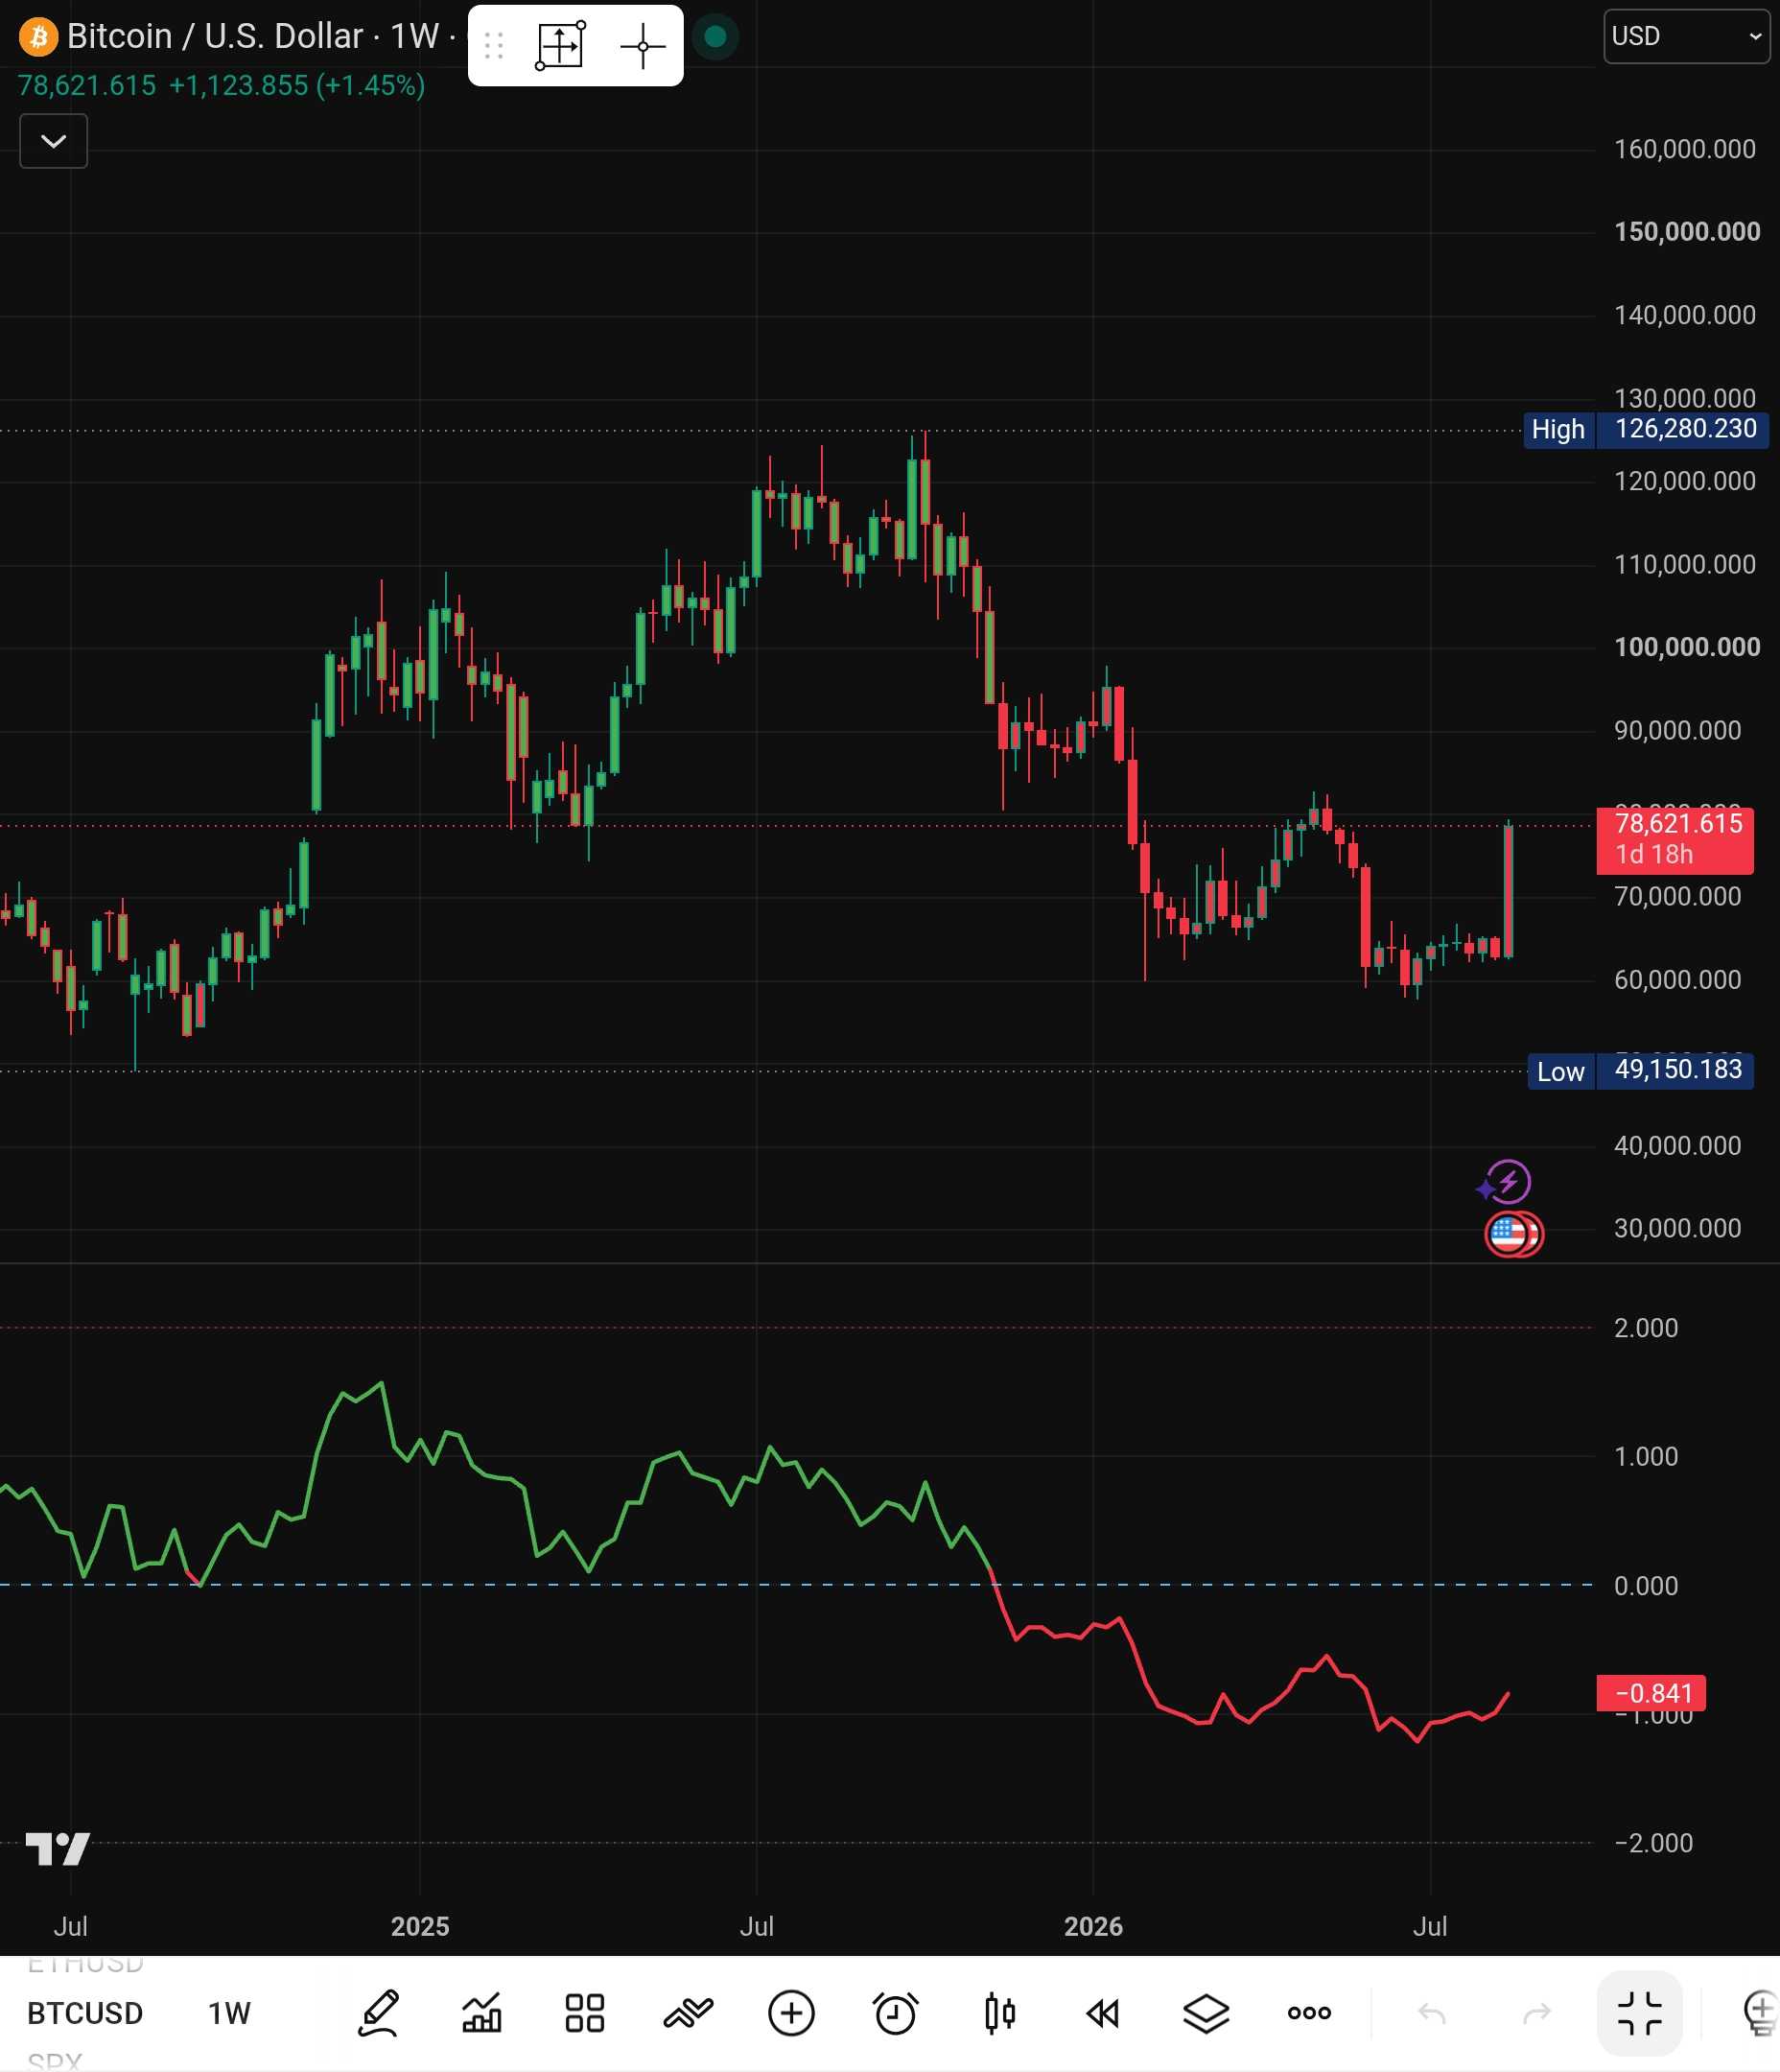
MVRV Z-Score: -0.841 - Macro Bottom Zone
The chart below shows BTC/USD on the weekly timeframe, with the MVRV Z-Score at -0.841.
What This Means
The MVRV Z-Score compares Bitcoin's market cap to its realized cap (what BTC would be worth if all coins were sold at their last transaction price). A reading of -0.841 means the market cap is below the realized cap - all BTC holders are, on average, in a paper-loss position.
Historical context:
- Jan 2015: MVRV approx -0.5 to -1.0, BTC bottomed ~$155
- Nov 2022: MVRV approx -0.3 to 0, BTC bottomed ~$15,500
A reading below zero has only occurred at absolute cycle bottoms. Combined with the price action - a V-bottom off $49,150 - we are at or within days of the macro cycle bottom.
Candlestick Pattern
- The Drop: Steep decline from $126,280 high to $49,150 low (~61% drawdown)
- The Bounce: Massive bullish candle from $49k to $78k (+60% in one weekly candle)
- Consolidation: Small doji candles near $60-65k before the current leg up - indecision resolved to the upside
Key Levels
| Level | Price | Significance |
|---|---|---|
| Absolute Low | $49,150 | Major support - tested and holding |
| Consolidation Zone | $60,000-65,000 | Immediate support / breakout level |
| Current Price | $78,621 | Active rally (+1.45% this week) |
| Resistance 1 | $90,000-95,000 | Previous support (now resistance) |
| ATH | $126,280 | Ultimate target |
3-Month Projection
Based on historical post-bottom recovery patterns:
- 2015 cycle: +80% from bottom in first 3 months
- 2022 cycle: +130% from bottom in first 3 months
- Average: ~+100% from bottom
Scenarios
Bull Case: $90,000-120,000 If the current rally holds and we break through the $90-95k resistance zone, a retest of the $126k ATH follows quickly.
Base Case: $85,000-100,000 A pullback to retest $60-65k support provides a healthier setup for the next leg up, targeting $90k+.
Key Watch: The $90-95k zone is the make-or-break level. A clean break above it opens the path to ATH.
Bottom Line
$90k-120k range in 3 months if the bottom is confirmed. But watch for a retest of $60-65k - that would be the healthier entry before the next leg up.
Analysis based on MVRV Z-Score, candlestick patterns, and historical cycle data.
Disclaimer
Not Financial Advice (NFA). This analysis is provided for informational and educational purposes only. It is not investment advice, a recommendation, or a solicitation to buy or sell any financial instrument.
This analysis was AI-assisted. While the author has made reasonable efforts to ensure accuracy, no guarantees are made regarding the completeness, reliability, or timeliness of the information contained herein.
No Liability. The author accepts no liability for any losses, damages, or losses arising from the use of or reliance upon this analysis. Always conduct your own research and consult with a qualified financial advisor before making any investment decisions.
Trade at your own risk.